
County Releases Latest COVID-19 Data
County officials developed criteria and conditions that must be considered in order for the county to continue with a gradual reopening of businesses, public amenities and relaxing of restrictions. The county’s goals include a decrease in new cases, deaths, and hospitalizations; as well as an increase in the capacity of both county hospitals and COVID-19 testing. The county’s interactive COVID-19 dashboard reports ten metrics daily and indicates the progress of meeting each criterion.
The ten metrics all fall into one of three categories including hospital capacity, COVID-19 surveillance, and testing. Wednesday, the county added a twelfth slide to the dashboard with detailed information on each of the ten metrics. For instance, the goal to keep the utilization of acute care beds under 70% is measured by the percentage of all acute care beds in use. The county is monitoring the days of adequate capacity of acute care beds. A day of adequate capacity occurs when the three-day rolling average meets or exceeds the goal.
Montgomery County COVID-19 Dashboard as of June 4 (click on photo to enlarge):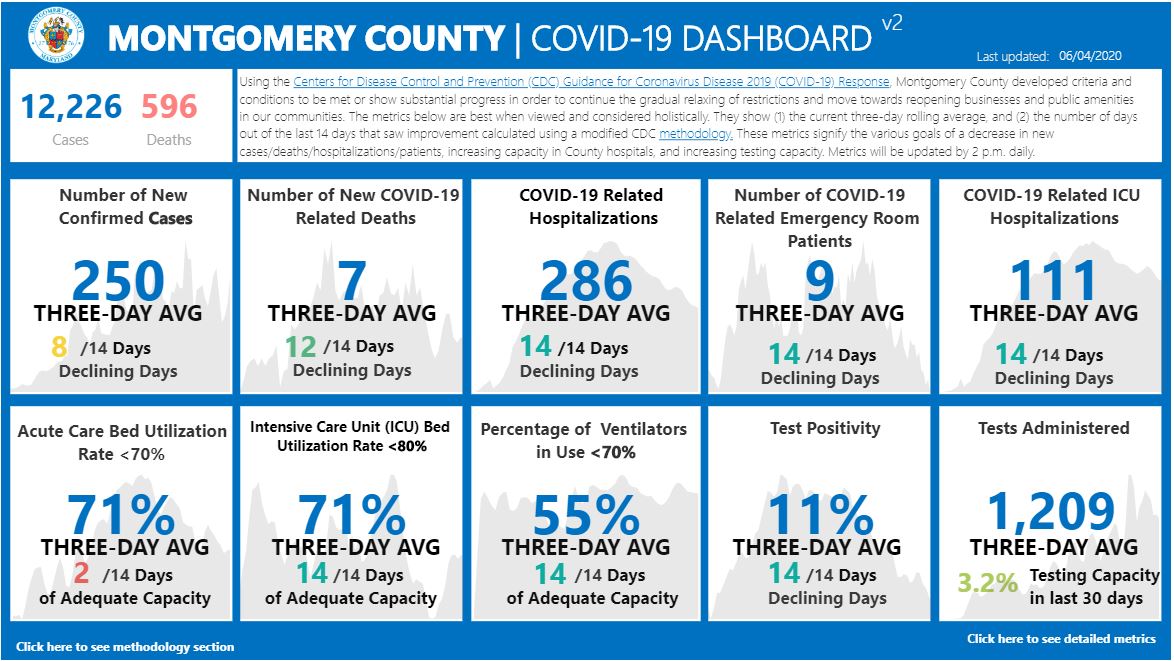
Montgomery County COVID-19 Dashboard as of June 3 (click on photo to enlarge):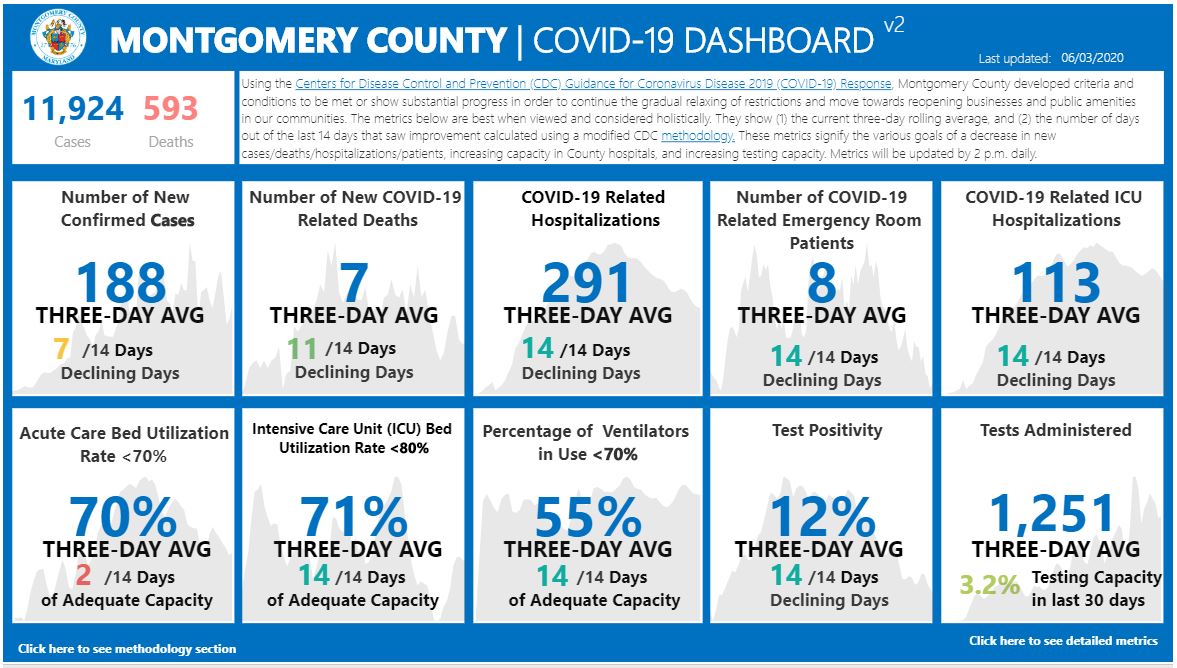
The data posted Thursday afternoon were:
• Number of new confirmed positive cases each day: 250 (three-day average); eight declining days out of the last 14
• Number of COVID-19 new deaths each day: seven (three-day average); 12 declining days
• COVID-19 related hospitalizations: 286 (three-day average); 14 declining days
• Number of COVID-19 related emergency room patients: 8 (three-day average); 14 declining days
• COVID-19 related intensive-care unit hospitalizations: 111 (three-day average); 14 declining days
• Acute care bed utilization rate: 71% (three-day average); the county benchmark of 70% or less has been met two of the last 14 days
• Intensive Care Unit bed utilization date: 71% (three-day average); the county benchmark of 80% or less has been met 14 out of the last 14 days
• Percentage of ventilators in use: 55% (three-day average); the county benchmark of 70% or less has been met 14 out of the last 14 days
• Test positivity rate: 11% (three-day average); 14 declining days
The county also set goals for testing capacity, test positivity rate, contact tracing, and prioritizing equity. More detail on each of these goals is available on the county’s website, here.
Engage us on Facebook
Follow us on Twitter
Tweets by @mymcmedia